
Figure 2. A comparison between the mutant-inhibitor complex and the WT-inhibitor complex structures for several major mutation types.
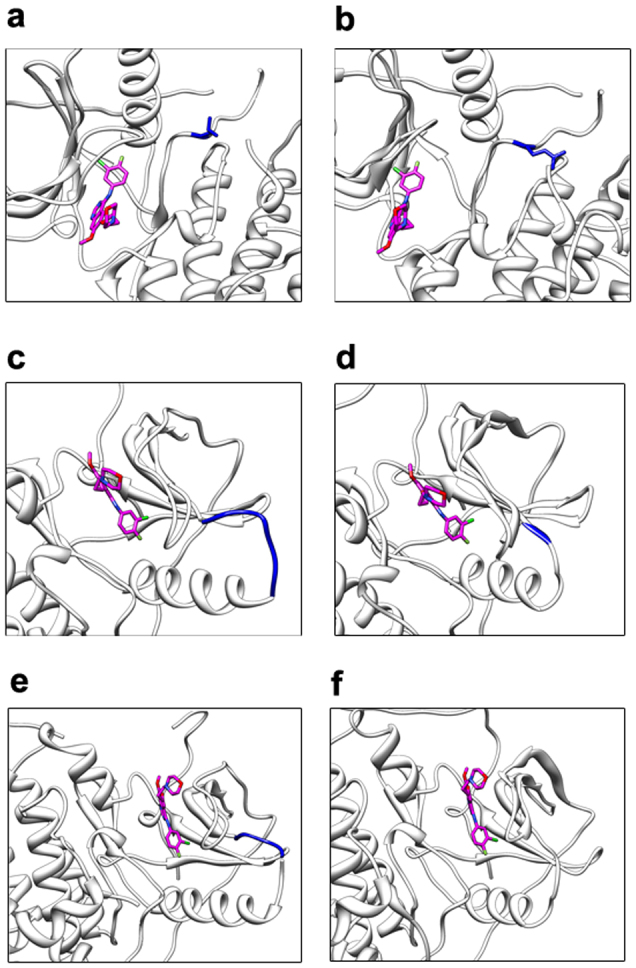
In each diagram, a portion of a WT/mutant-inhibitor complex is presented, with the inhibitor (gefitinib) colored pink and the original/mutation site colored blue. Diagrams (a) and (b) show a comparison between the WT-gefitinib system and the L858R-gefitinib system. Similarly, diagrams (c) ~ (d) and (e) ~ (f) show mutations delL747_P753insS and delE746_A750 respectively.