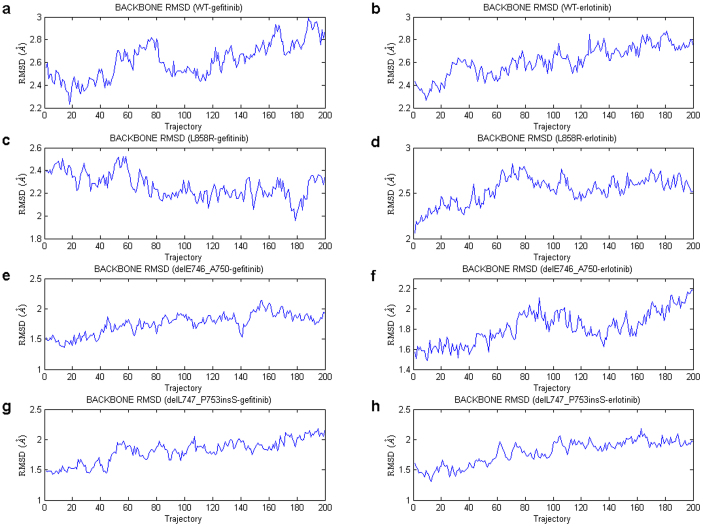
Figure 3. An investigation of the stabilization of several solvated mutant/WT-inhibitor systems.
Diagrams (a) and (b) show the plots for trajectory (frames) vs. backbone RMSD (Å) in the MD simulation period (2 ns), with regard to the solvated WT-gefitinib and WT-erlotinib systems respectively. Similarly, diagrams (c) ~ (d), (e) ~ (f) and (g) ~ (h) present the plots for the systems involving L858R, delE746_A750 and delL747_P753insS respectively.

