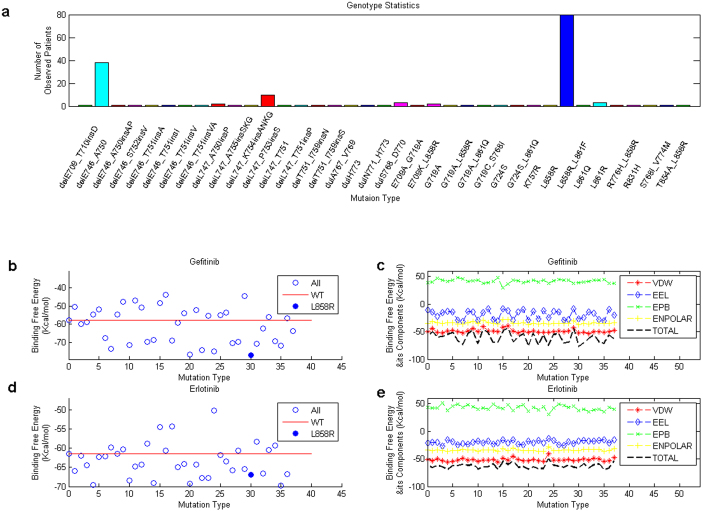
Figure 4. Statistics on mutation types and their binding free energies with the two inhibitors.
Part (a) shows the statistics of the 37 mutation types of our observed 168 patients. Parts (b) and (d) present the distributions of total binding free energies of the mutants (with WT protein included) with two inhibitors gefitinib and erlotinib. The red lines and solid blue circles show the binding free energy for the WT EGFR and the L858R mutant respectively. Parts (c) and (e) display the distributions of the binding free energy components, which encompass VDW, EEL, EPB and ENPOLAR, for the two inhibitors.

