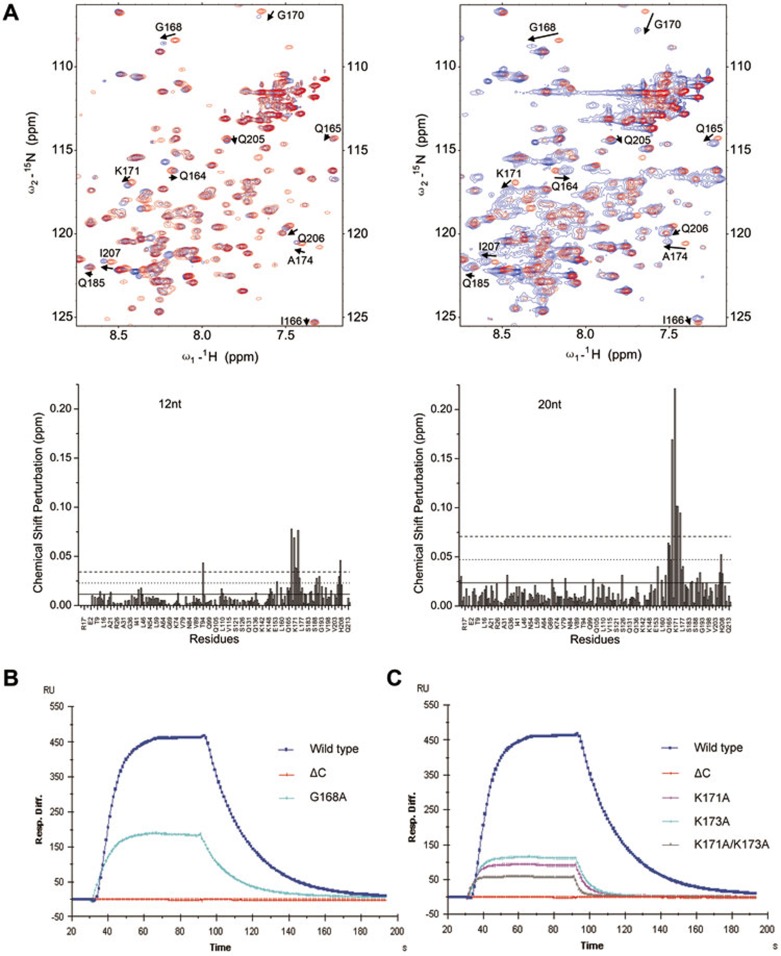
Figure 3.
Identification of critical residues of FAAP24 for ssDNA binding. (A) NMR titration experiments of FL-FAAP24 with 12-nt (upper left) and 20-nt (upper right) ssDNA. Five HSQC spectra were recorded with ssDNA:FL-FAAP24 ratio at 0:1, 0.3:1, 0.5:1, 1:1, and 2:1, respectively. For better illustration, only the first (red, ssDNA:FL-FAAP24 = 0:1) and the last (blue, ssDNA:FL-FAAP24 = 2:1) spectra were shown and overlapped. Peaks that were obviously shifted were labeled by arrows. In each panel, solid, dotted and dashed horizontal lines correspond to the averaged CSP, one and two standard deviations above the averaged CSP, respectively (see Materials and Methods for details). (B) SPR assay measuring ssDNA-binding affinity of the G168A mutant and the C-terminal (HhH)2 domain truncation mutant (ΔC). (C) SPR assay measuring ssDNA-binding affinity of K171A, K173A and K171A/K173A mutants.

