Figure 4.
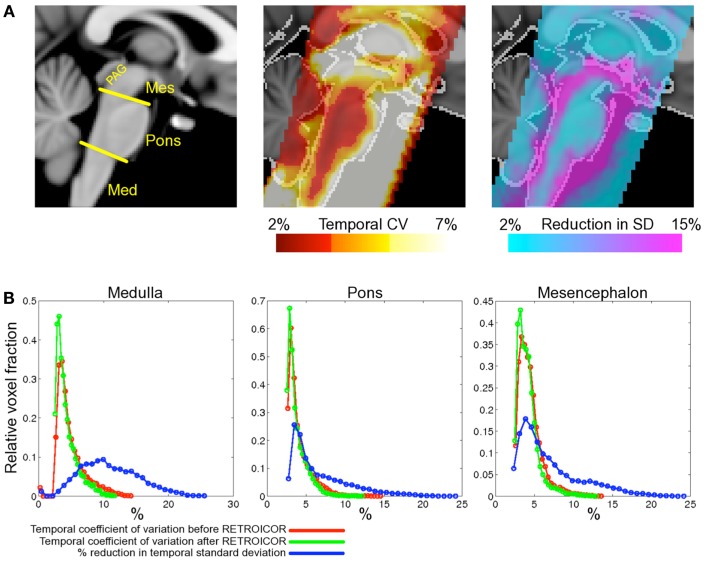
Spatial localization of brainstem signal variation measured in 12 subjects (adapted from Harvey et al., 2008). Top row (A) left depicts a midline sagittal slice through the MNI standard brain with the approximate subdivisions of the brainstem indicated (Med, medulla; Mes, mesencephalon; PAG, periaqueductal gray matter). Middle: the mean CV over the group of subjects studied is superimposed to show regions of high signal variability. Highest signal variation was observed in the mesencephalon and near the surface of the pons and medulla. The improvement following application of the modified RETROICOR (3C4R1X) model is demonstrated in the right-most image, which shows the percentage reduction in temporal standard deviation when compared to baseline (no correction). Significant reduction in signal variance was found in and around the PAG and the edges of the pons and medulla. The lower portion of the figure (B) shows histograms of the temporal coefficient of variation for both the uncorrected (red) and corrected (green) resting data in the three brainstem regions examined. Voxel counts were normalized to the total number of voxels in each region. Also shown for each region is the histogram of percentage reduction in temporal standard deviation (blue), and demonstrates that the largest benefit of physiological noise modeling occurred in the medulla, where the proportion of voxels with a reduction in SD greater than 10% is largest, although clearly modeling was beneficial in pons and mesencephalon also. (Reproduced from Harvey et al., 2008).

