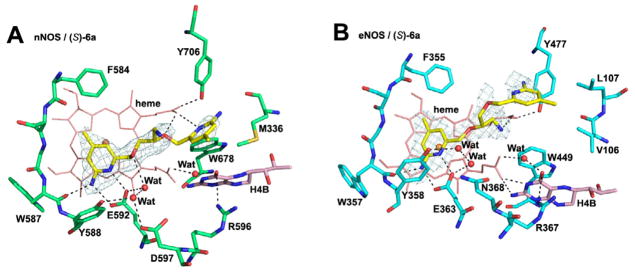
Figure 1.

View of the active site of nNOS (A) (PDB code: 4K5D) and eNOS (B) (PDB code: 4K5H) in complex with inhibitor (S)-6a. Shown also are the omit 2Fo – Fc density maps for inhibitor contoured at the 2.5 σ level. Relevant hydrogen bonds are depicted as dash lines. All structural figures were prepared with PyMol (www.pymol.org).
