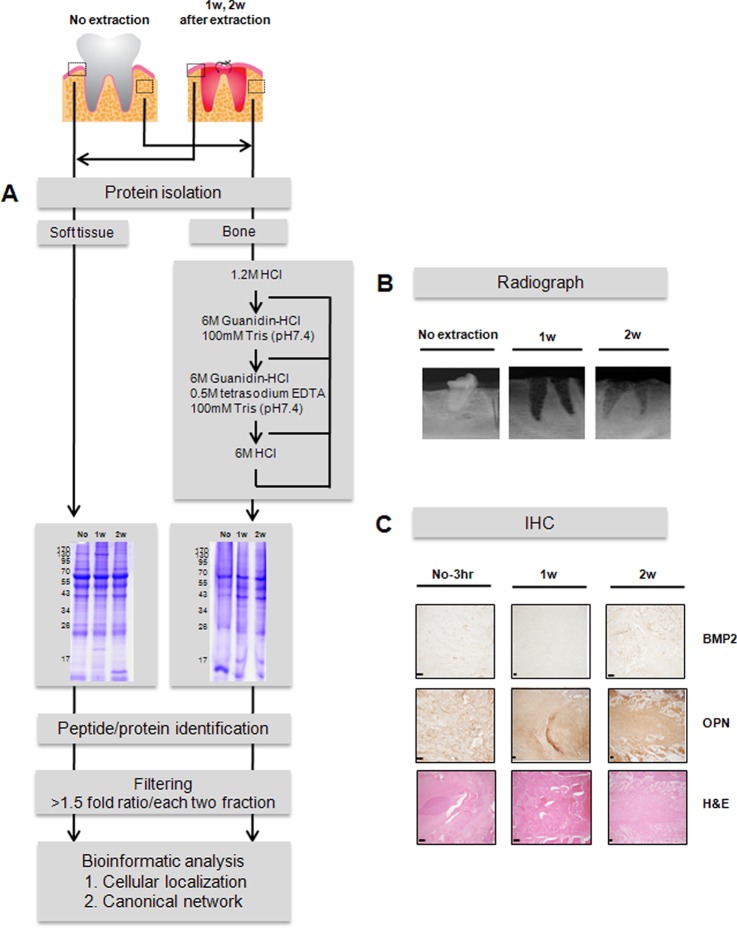
Fig. 1.
Quantitative proteomic analysis of soft tissue and bone following tooth extraction. A, strategy for identifying proteins with altered expression in gingival soft tissue and alveolar bone following tooth extraction in a porcine model. After tooth extraction, the proteins isolated from soft tissue and bone were subjected to SDS-PAGE and tryptic digestion. The digested peptides were subjected to LC-MS/MS. The regions outlined by dotted lines in the upper left indicate the locations of the extracted samples from soft tissue and bone. “No” indicates no tooth extraction; 1w, 1 week after tooth extraction; 2w, 2 weeks after tooth extraction. B, intraoral x-ray images. C, immunohistochemical images of osteoblastic markers. N-3 h, adjacent non-tooth extraction region at 3 h post-extraction; BMP2, bone morphogenetic protein 2; OPN, osteopontin; H&E, hematoxylin and eosin stain. Magnification, 100×; scale bars, 100 μm.

