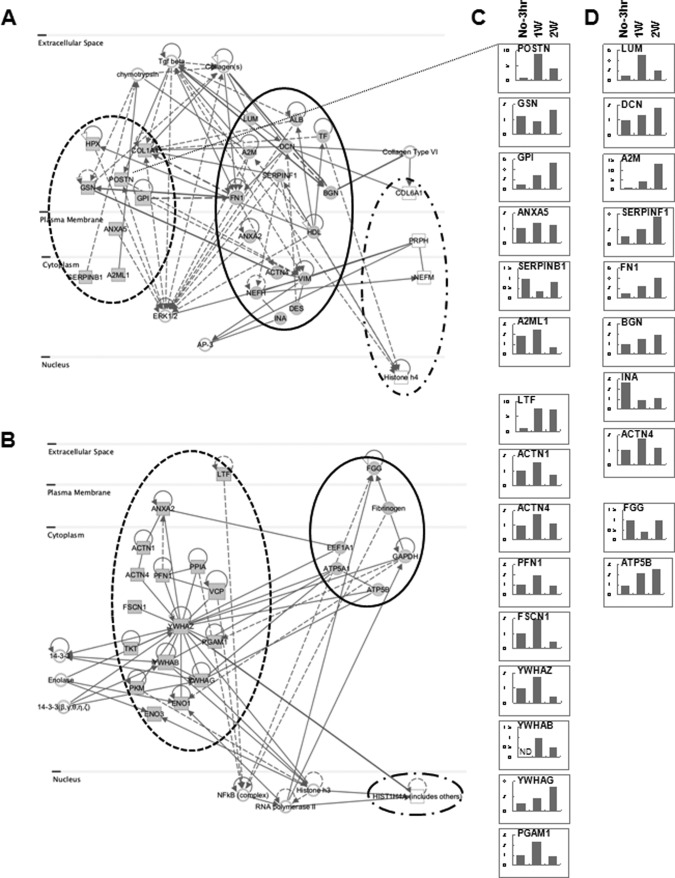
Fig. 3.
Complementary protein interaction network of expression-altered proteins. An interaction network was built based on the 62 significantly differentially expressed proteins. A, reciprocal network of proteins involved in cellular assembly and organization. B, reciprocal network of proteins relevant to disease. Gray rectangles represent targets differentially expressed only in soft tissue; white rectangles represent targets differentially expressed only in bone; gray circles represent targets differentially expressed in both soft tissue and bone. C, D, qPCR analysis of gene expression in soft tissue in A and B. C, targets detected only in soft tissue in A and B. D, targets detected in both soft tissue and bone in A and B. Y-axis is the relative fold ratio based on data from the No-3 h samples (= 1). No-3 h, adjacent non-tooth extraction region at 3 h post-extraction; 1w, 1 week after tooth extraction; 2w, 2 weeks after tooth extraction. ND, not detected.

