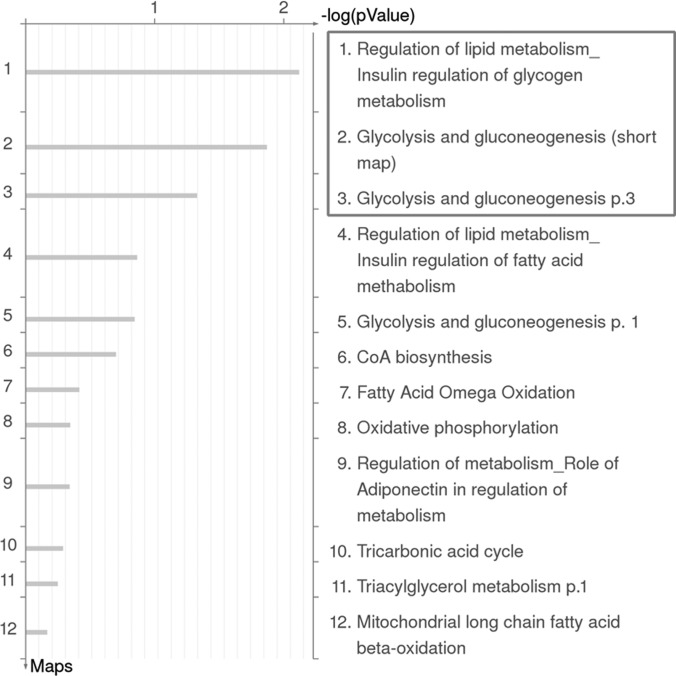
Fig. 1.
Representation of ontological category of differentially expressed proteins in control and FADD-D cell lines by GeneGo Map Folders analysis. The results were ordered by -log10 of the p value of the hypergeometric distribution. Detailed GeneGo Maps in Fold “energy metabolism and its regulation” were shown.

