Fig. 3.
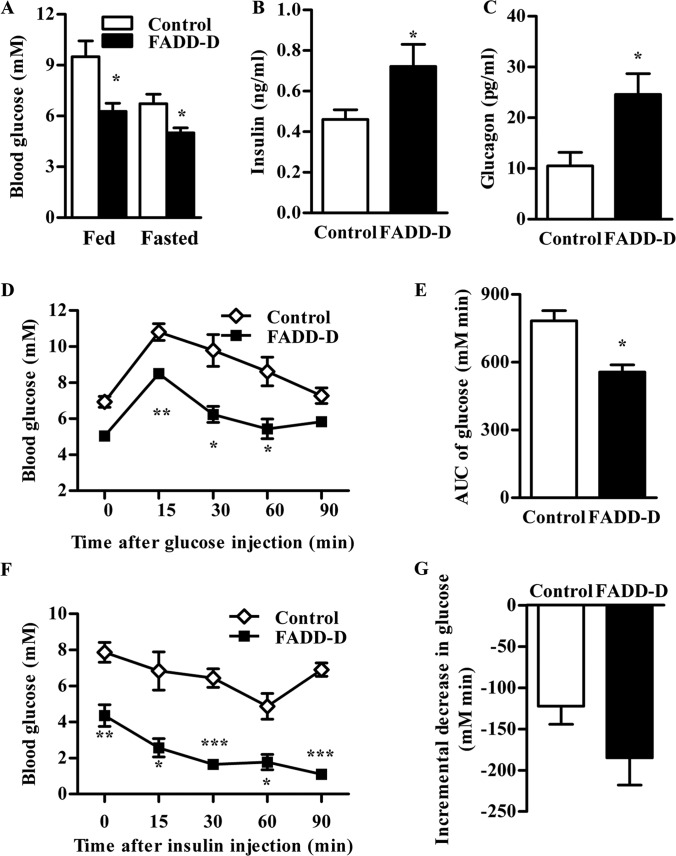
Low blood glucose and increased glucose tolerance in FADD-D mice. A, Fed and fasted blood glucose level in mice (n = 4–9 for each group). B and C, Fasted serum insulin (B) and glucagon (C) levels in mice (n = 6–12 for each group). D, IPGTT of FADD-D (black squares) and control mice (white diamonds). Mice were injected intraperitoneally with 1.0 g/kg glucose, and blood glucose levels were monitored at the intervals indicated (n = 3). E, The histogram represents the cumulative increase in blood glucose from basal level after the injection of glucose during IPGTT. F, IPITT of FADD-D (black squares) and control mice (white diamonds). Mice were injected intraperitoneally with 0.5 U/kg insulin, and blood glucose levels were monitored at the intervals indicated (n = 3). G, The histogram represents the cumulative decrease in blood glucose from the basal level after the injection of insulin during IPITT. Data are presented as means ± S.E. Statistical significance was assessed by two-tailed Student's t test, *p < 0.05, **p < 0.01, ***p < 0.001.

