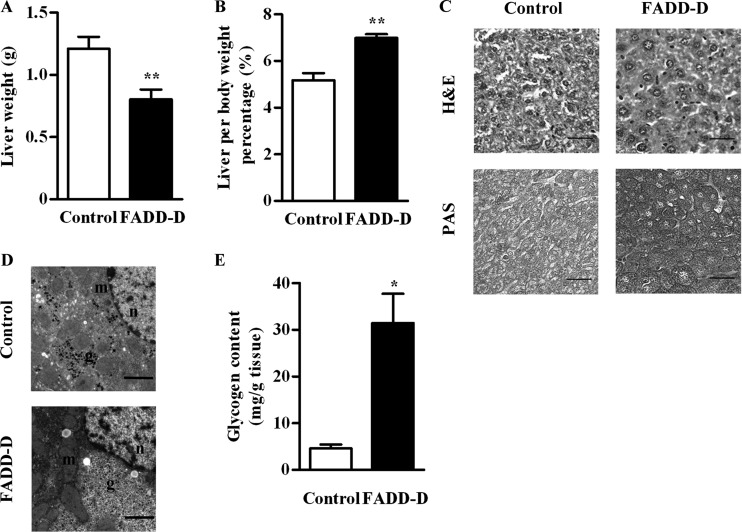
Fig. 4.
Increased hepatic glycogen content in FADD-D mice. A, Liver weights of FADD-D and control mice (n = 4). B, Weights of liver normalized by body weight for FADD-D and control mice (n = 4). C, H&E staining and PAS staining for glycogen in the liver sections of FADD-D and control mice. Representative images are shown. Scale bar, 20 μm. D, The representative images of electron microscopic analysis of liver. Scale bar, 2 μm. “g” indicates glycogen, “m” indicates mitochondria, and “n” indicates nucleus. E, Hepatic glycogen content determined by glucose assay kit (n = 6). Data are presented as means ± S.E. Statistical significance was assessed by two-tailed Student's t test, *p < 0.05, **p < 0.01.

