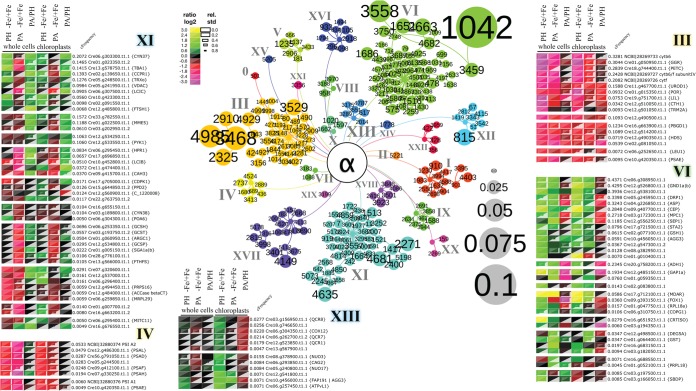
Fig. 3.
Results obtained by multiple agglomerative hierarchical clustering approaches using pyGCluster of protein ratios comparing iron deficient (−Fe) with iron sufficient (+Fe) in photoautotrophic growth conditions (PA) or in photoheterotrophic growth conditions (PH) or comparing PA with PH in iron sufficient growth conditions in whole cells or isolated chloroplasts. Shown are the cNode map and five heat maps for selected communities. The cNode map highlights the most frequent clusters with their clusterID and their membership to one of the 23 communities identified. Communities are indicated in different colors and roman numerals. The cluster frequency is illustrated by the node size as shown in the legend (gray nodes). For detailed information on the clusters see Supplemental Table T2. The cFrequency of a protein is equal to the sum of all cluster frequencies the protein is part of, within its community. Heat maps are subdivided to illustrate the separation of subcommunities visible as branches in the cNode map.

