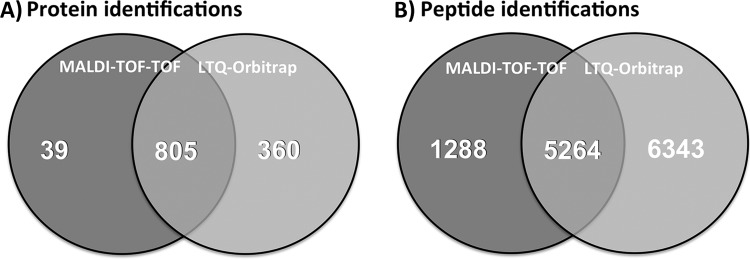
Fig. 2.

Venn diagrams of (A) identified proteins and (B) identified peptides. The numbers over dark gray areas represent identifications in the GeLC-MALDI-TOF-TOF workflow. The numbers over light gray areas represent identifications made via GeLC-LTQ-Orbitrap from the same samples. Numbers in the intersection areas relate to proteins that were identified with either method.
