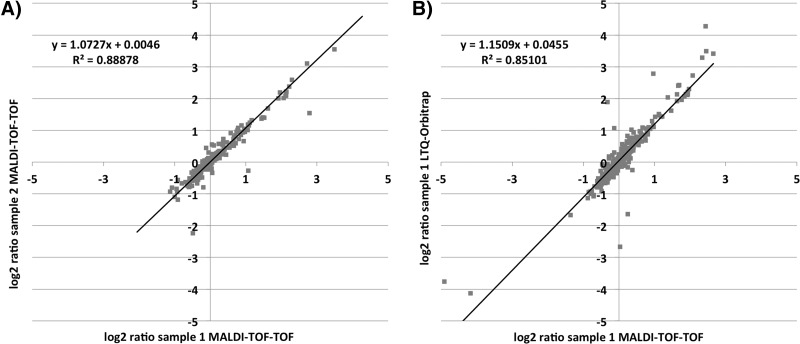
Fig. 3.
Scatter plots for (A) two replicates analyzed with MALDI-TOF-TOF and (B) the same sample analyzed with MALDI-TOF-TOF and with LTQ-Orbitrap. A, log2 ratios of two exponentially grown biological replicates against the internal standard, both analyzed with MALDI-TOF-TOF, are plotted against each other. B, log2 ratios of one exponentially grown biological replicate against the internal standard, one analyzed with MALDI-TOF-TOF and the other with LTQ-Orbitrap, are plotted against each other. Linear trend lines (black) with the linear equation (y) and coefficient of determination (R2) were calculated.

