
Fig. 1.
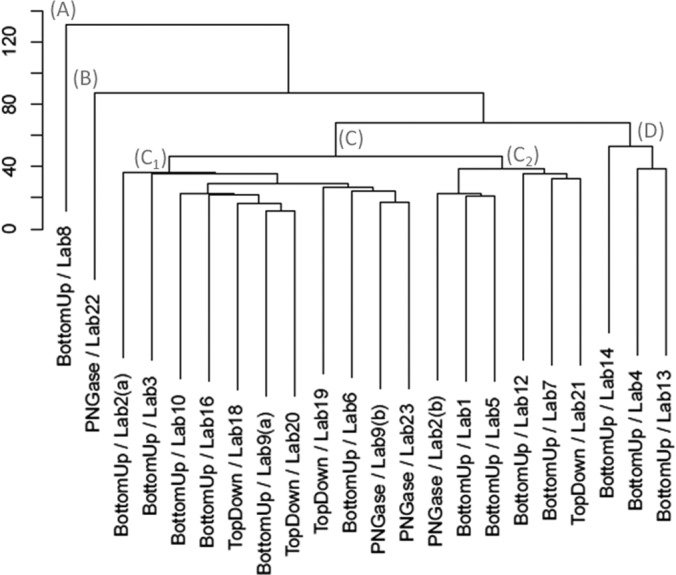
Agglomerative hierarchal clustering of N-glycans profiles for PSA and PSA high isoform from the participating labs. The dendrogram illustrates by clustering (X axis) and height (Y axis) the degree of similarity of profile of different N-glycans of PSA and PSA high Isoform detected by different labs. The main clusters reported are: (A), (B), (C), (D), and sub-clustering could be distinguished (C1), (C2).