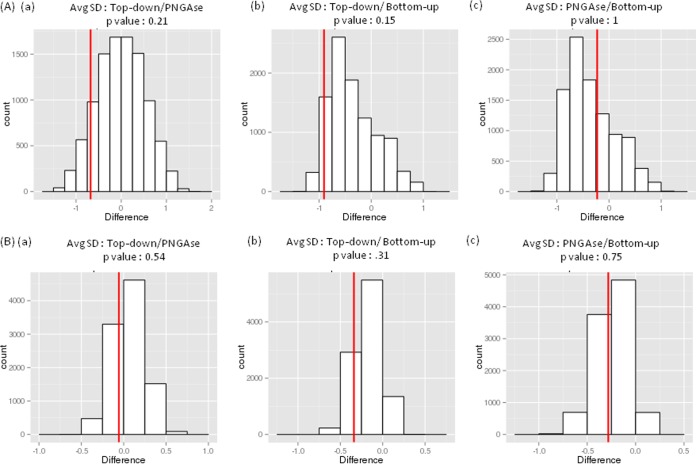
Fig. 3.
Comparison of robustness for bottom-up, top-down and PNGAse F release methods used by the participating laboratories. (A) Data from 22 participating laboratories were included in the permutation tests. (B) Data from consensus cluster C were used in the permutation tests. The red lines show the difference between the average standard deviations for the two methods in each plot. The p-values correspond to double the area of bars to the left of the red line in each plot.

