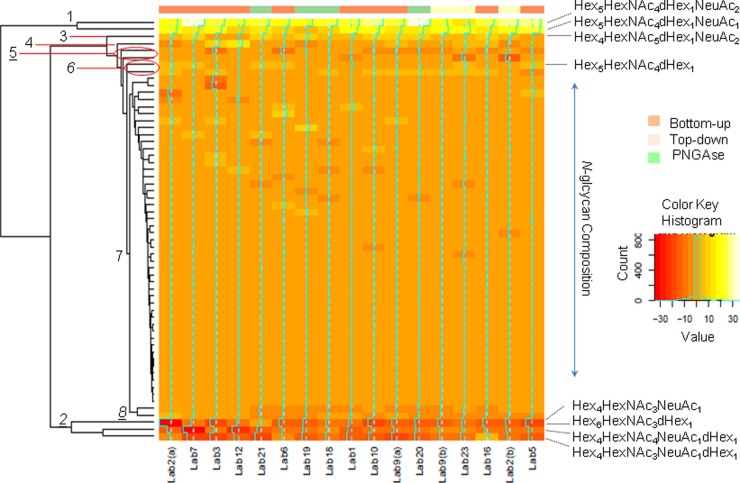
Fig. 4.
Heat map of the consensus data. Agglomerative hierarchical clustering results were processed based on the differences of relative intensity values for glycan compositions between PSA and PSA high isoform. Orange color indicates a null difference of relative intensity between PSA and PSA high isoform, yellow indicates a positive difference, red indicates a negative difference. The N-glycan compositions of cluster 7 (80% of the total compounds) are similar between PSA and PSA high isoform. Compositions are more intense in PSA high isoform than PSA for the cluster 1 (Hex5HexNAc4dHexNeuAc2, Hex5HexNAc4dHexNeuAc), cluster 3 (Hex4HexNAc5dHexNeuAc2), cluster 4 (NeuAc1Hex5HexNAc4NeuAc), cluster 6 (Hex5HexNAc4dHex, NeuAc2Hex5HexNAc4NeuAc2). Compositions are less intense in PSA high isoform than PSA for cluster 2 (Hex4HexNAc4dHexNeuAc, Hex4HexNAc3dHexNeuAc, Hex6HexNAc3NeuAc), cluster 5 (Hex4HexNAc4NeuAc, Hex5HexNAc2), cluster 8 (Hex3Hex5dHexNeuAc, Hex4Hex3NeuAc). In order to confirm the significance of the differences in N-glycan composition abundances between PSA and PSA high isoform, a W-test was used and revealed 8 significant compositions (indicated in bold).

