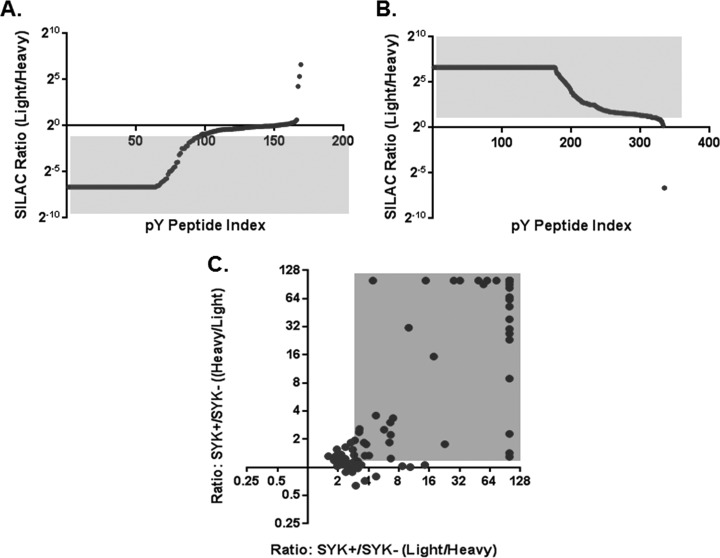
Fig. 3.
Ratio distributions of phosphopeptide intensity before and after kinase reaction using reciprocal SILAC quantifications. A, SYK was added in the heavy fraction, whereas light fraction was the control. B, SYK was added in the light fraction, whereas heavy fraction was the control. C, Dot-plot depicting the overlap of the reciprocal data sets of tyrosine phosphorylation sites identified using in vitro kinase reaction.

