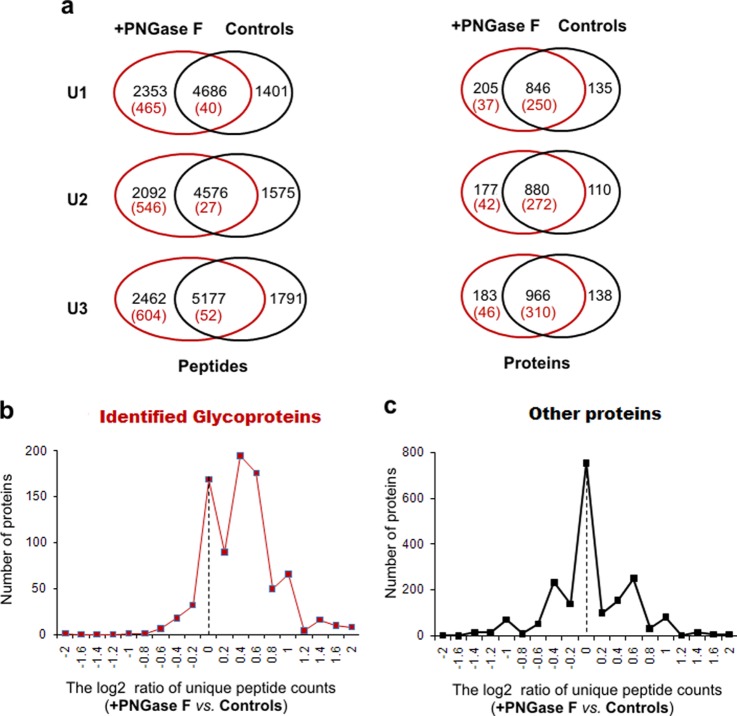
Fig. 3.
The comparisons of three different urinary proteomes (U1, U2, and U3) with and without PNGase F (+PNGase F versus Control, supplemental Fig. S6) to determine the impact of upfront de-N-glycosylation on overall proteomic performance. A, A Venn-Diagram comparison between +PNGase F and Control at the peptide and the protein levels. The numbers in parentheses indicate the deglycopeptides or glycoproteins identified. In B and C the x axis indicates the log2 value of the ratio of unique peptide counts for either glycoproteins (B) or other proteins (C) identified in common between +PNGase F and Control. The y axis designated the number of proteins within that specific ratio.

