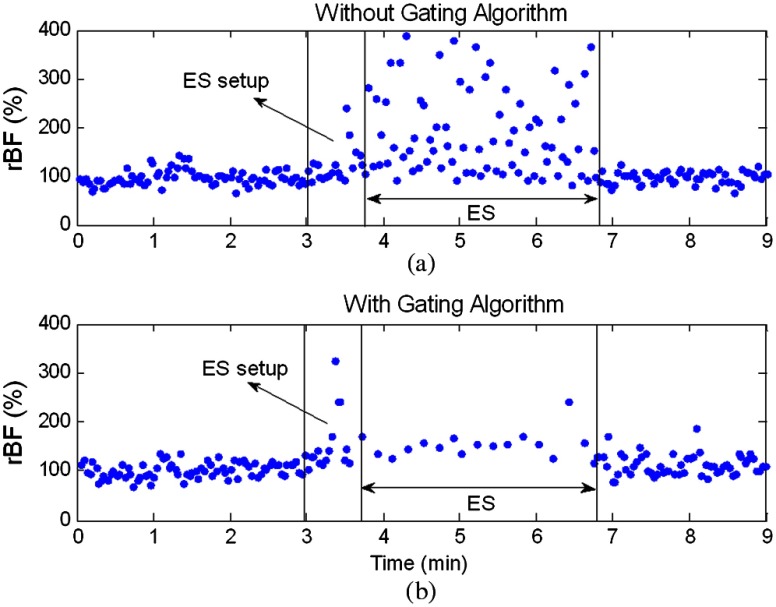
Fig. 3.
Relative blood flow (rBF) responses during 3-min ES at 2 Hz, measured by the DCS flow-oximeter without (a) or with (b) the gating algorithm. The time period between the first and second marks (vertical lines) indicates the transition to adjust the ES current from zero to the maximum tolerant level (i.e., ES setup). The optical data collected during the period of ES setup were excluded due to the large noises induced by the adjustment of ES current. The ES started from the second mark and ended at the third mark. The gating algorithm (b) significantly reduced noise due to motion artifact.

