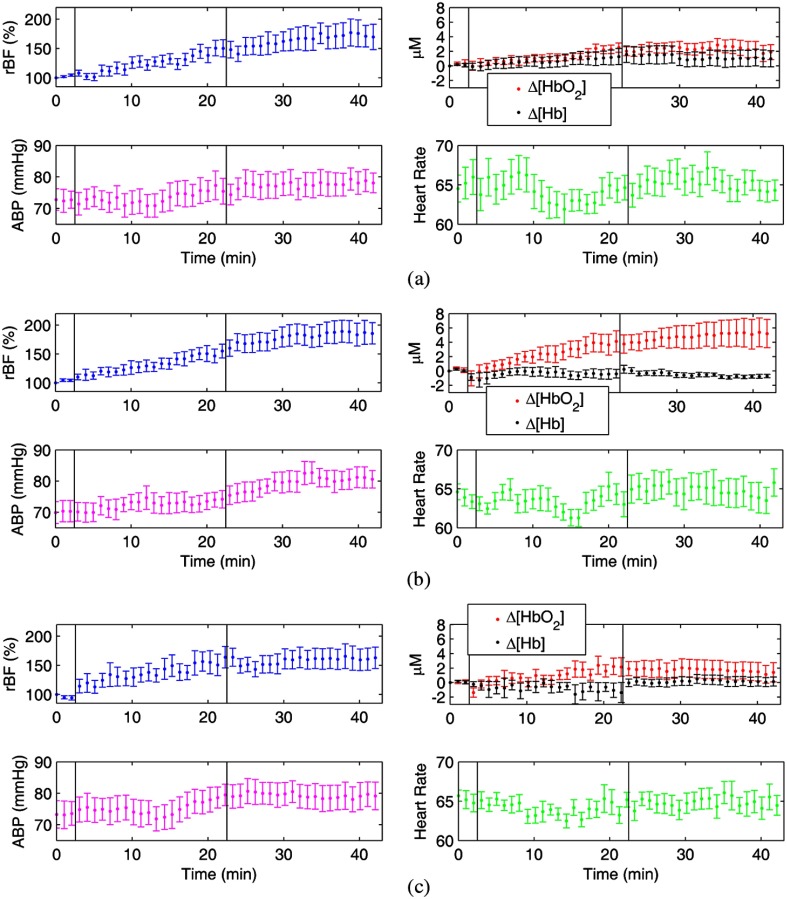
Fig. 4.
The average time course physiological responses [rBF, , , arterial blood pressure (ABP) and heart rate] to ES over 10 subjects measured from the stimulated muscles in the right legs with ES at 2 Hz (a), 10 Hz (b), and 50 Hz (c). Data obtained from 10 subjects were aligned based on the marks (vertical lines) made at the beginning and end of ES.

