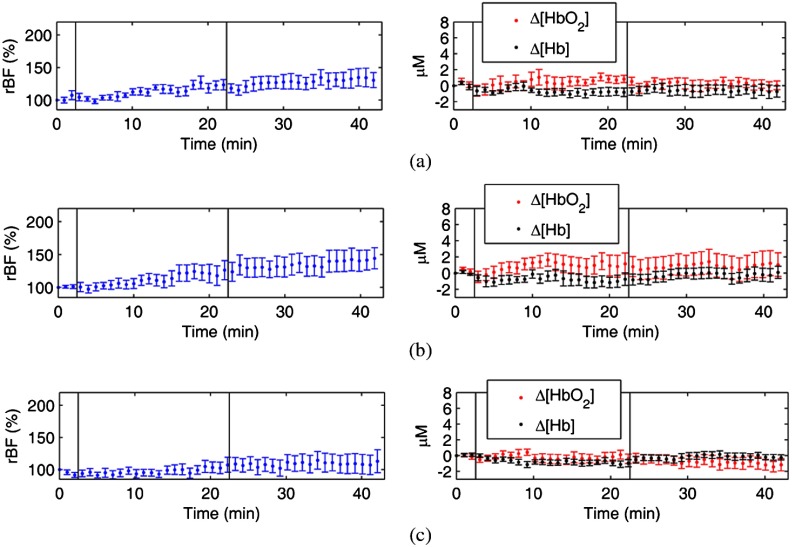
Fig. 5.
The average time course hemodynamics responses to ES over 10 subjects measured from the control muscles in the left legs without ES. The hemodynamic responses (rBF, , ) to ES at low (2 Hz), medium (10 Hz), and high (50 Hz) frequencies are displayed in (a), (b), and (c), respectively. The two vertical lines (marks) indicate the beginning and end of ES.

