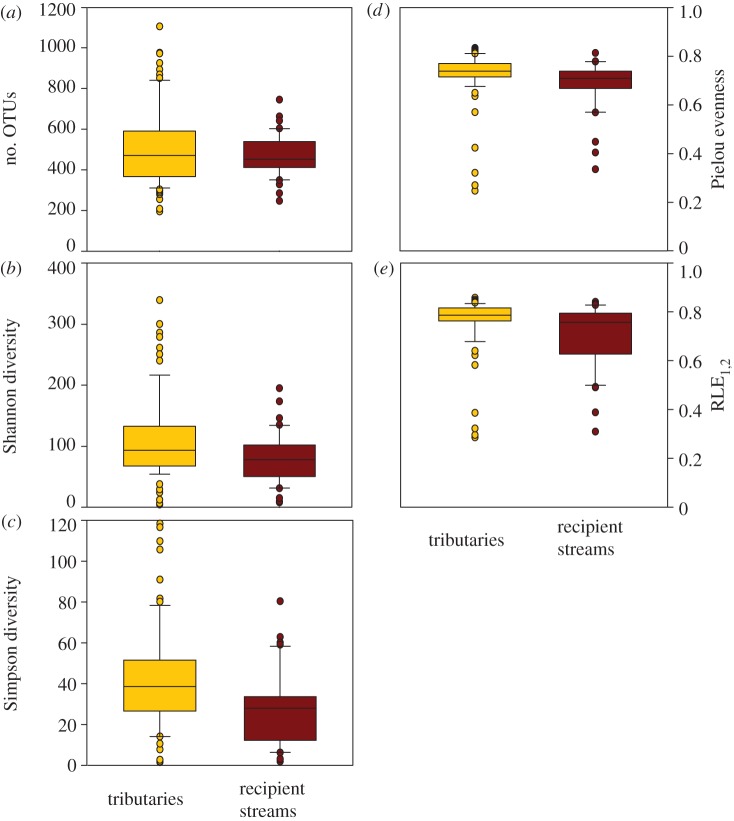
Figure 2.
Biofilm diversity and evenness at confluences. (a) Mean richness, (b) Shannon diversity, (c) Simpson diversity, (d) Pielou evenness and (e) RLE1,2, upstream (tributaries, yellow) and downstream (recipient streams, red) of confluences. Recipient streams (n = 34) had significantly lower Shannon diversity (p < 0.05), Simpson diversity (p < 0.05), Pielou evenness (p < 0.01) and RLE1,2 (p < 0.05); OTU richness did not differ significantly.

