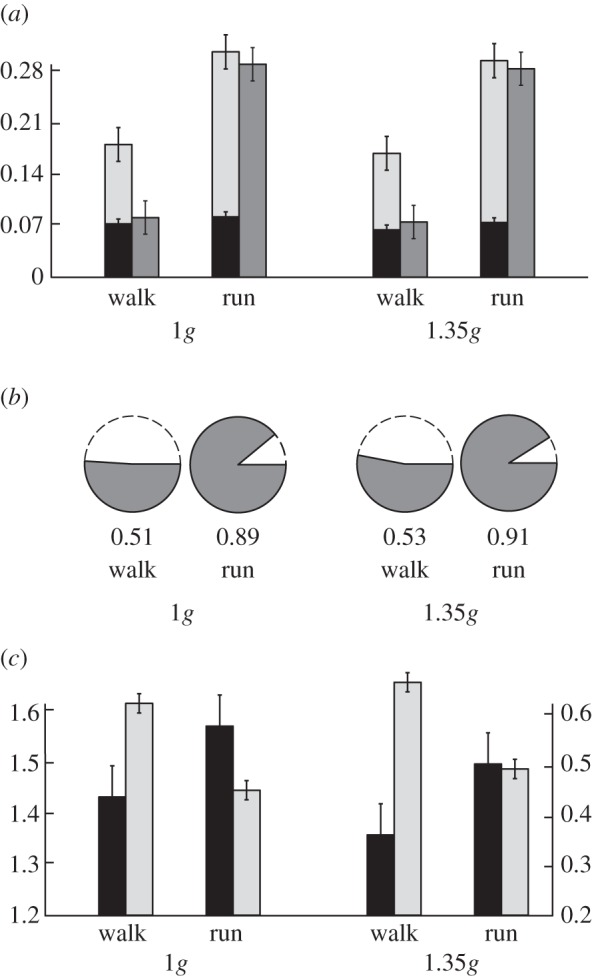
Figure 3.

Results of human walking and running analyses comparing normal (1g) and hypergravity (1.35g) conditions. (a) Force angle Θ (black), velocity angle Λ (light grey) and collision angle Φ (dark grey). The scale from 0 to 0.28 radians represents 0–16°. (b) Collision fraction is the ratio of actual to potential collision and is represented by solid areas of the pie charts. (c) Dimensionless stride length (left axis; black bars) and duty factor (right axis; light grey bars). Error bars indicate 95% CIs in all panels. Significant differences (p < 0.05) are found between gaits in all parameters except force angle Θ. Significant differences between 1 and 1.35g (p < 0.05) are found in force angle Θ (a), as well as dimensionless stride length and duty factor (c).
