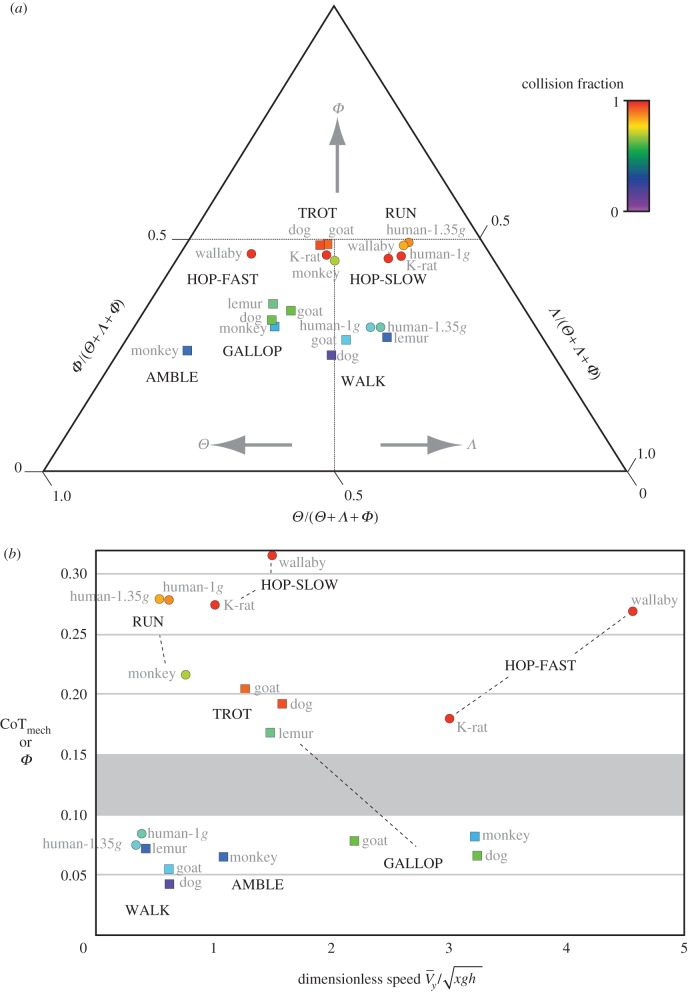
Figure 4.
Collision-based analysis of human locomotion together with gaits of other mammals from the literature. (a) Θ, Λ and Φ as a fraction of their sum plotted on ternary axes. (b) Mechanical cost of transport CoTmech or Φ as a function of dimensionless speed  . Filled circles indicate bipedal gaits and filled squares indicate quadrupedal gaits. Colour of data symbols indicates collision fractions with red indicating a collision fraction of one and violet a collision fraction of zero (for spectrum of intermediate colours, see colour scale at right). Collision-based analyses of non-human mammals are for goats and dogs [19], lemurs [17], monkeys [18], kangaroo rats (K-rat) and wallabies [33].

