
Figure 2.
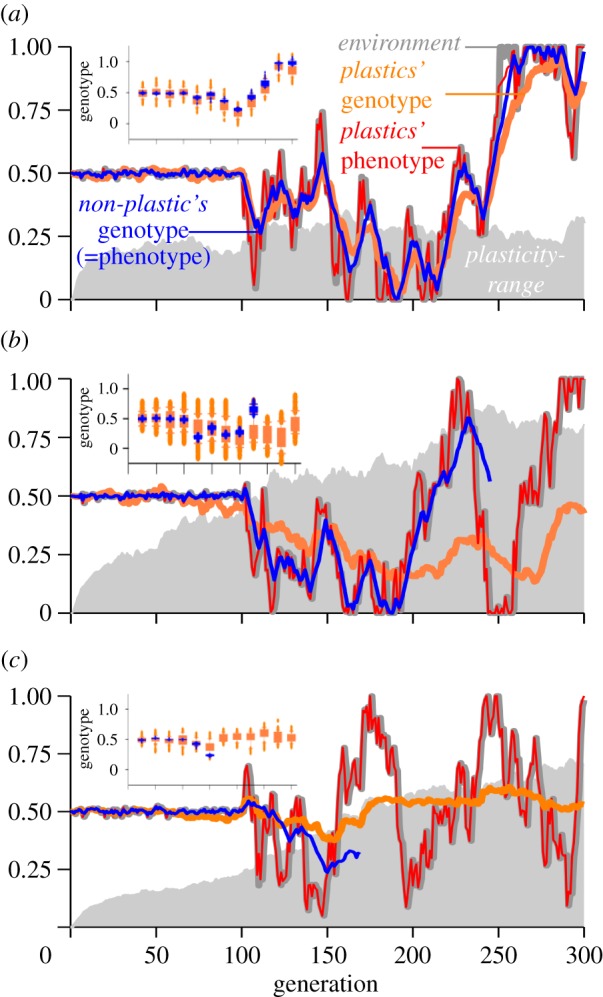
Examples of adaptive evolution of plastic and non-plastic populations under medium-low environmental fluctuations (Std-Dev-environment-change = 0.1) and different scenarios of mean-mutational-change and plasticity-costs. (a) At high mean-mutational-change and high plasticity-costs, plastics performed similar to non-plastics. Here, a high mean-mutational-change allowed both populations to closely track the environment. Plasticity-range was reduced compared with scenarios with lower costs but maintained owing to environmental fluctuations. (b) Under high mean-mutational-change but with low plasticity-costs, plasticity allowed a close phenotypic match to the environment and the persistence of the plastic population, but often non-plastics went extinct as shown in this example. (c) Under low mean-mutational-change and low plasticity-costs, plastic genotypes produced phenotypes that closely matched the environment while their genotypic values were intermediate across environmental fluctuations, and plasticity increased. Non-plastic genotypes could not adapt fast enough and quickly went extinct. At any given time and in all scenarios, genotypic variation was higher in the plastic population than in the non-plastic one. This is shown in inset boxplots in each panel, where blue boxes depict genetic variation of the non-plastic population and orange boxes that of the plastic population, sampled every 25 generations.