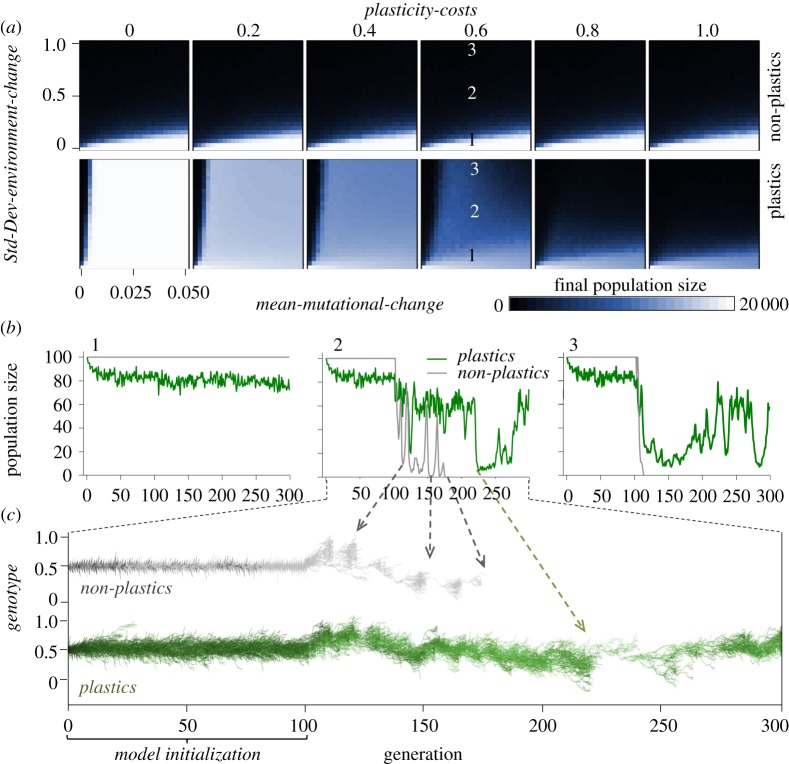
Figure 3.
(a) Results for population size for populations composed of either plastic or non-plastic genotypes from simulations sweeping over all parameter combinations of environmental stochasticity (Std-Dev-environment-change), mutation rate (mean-mutational-change) and plasticity-costs. Populations composed of plastic genotypes persisted over a much broader range of environmental stochasticity than populations of non-plastic genotypes, unless plasticity-costs were high, in which case they performed worse than non-plastic genotypes. (b) Examples of population dynamics for plastic and non-plastic populations at different levels of environmental stochasticity and mean-mutational-change = 0.04 and plasticity-costs = 0.6; panel numbers relate (a) and (b). (c) Example of clonal lineages trajectories (each line is a lineage) according to genotype and (for plastics) plasticity-range (lighter green colour depicts higher plasticity-range). Note that only very plastic lineages survived the strongest population bottleneck (as shown in corresponding (b) panel).

