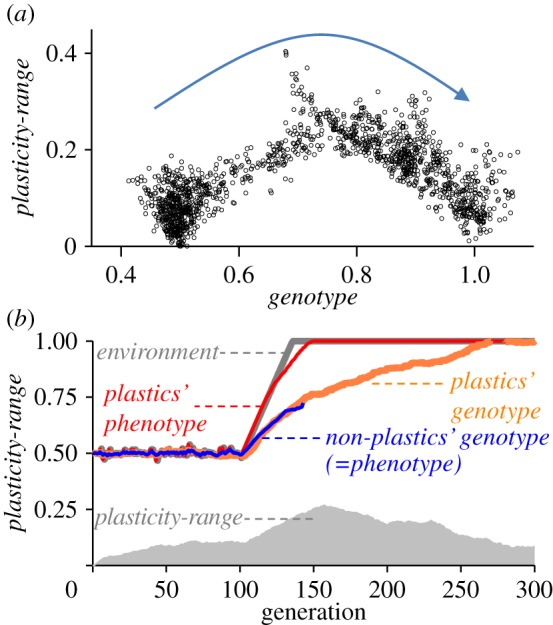
Figure 4.

Example of model run for a scenario of directional environmental change, where environment changed abruptly from 0 to 1 and then stabilized at 1 with mean-mutational-change = 0.005 and plasticity-costs = 0.7. (a) Shows for plastic individuals their position in the genotype versus plasticity-range space. The arrow indicate the pass of time (in generations), beginning with all individuals with genotype = 0.5 and plasticity-range = 0 (initialization conditions) and ending at the end of the simulation with individuals with genotypes close to 1 and reduced plasticity-range. (b) Same as in figure 2. It is shown how plasticity increased temporarily under selection and the plastic population expressed well-matched phenotypes, allowing the population to persist over enough generations to allow genotypes to slowly evolve towards the new optimum. Once the environment stabilizes, plasticity is rapidly reduced owing to costs of plasticity, causing genetic assimilation.
