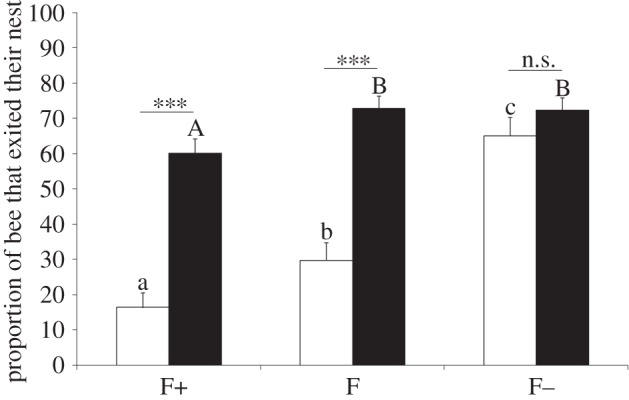
Figure 2.

Proportions of experimental bees in social and competition colonies that exited their nest. For details, see Material and methods and the electronic supplementary material. White and black bars indicate social and competition phase colonies, respectively. The different letters denote statistical differences between the worker groups within the social phase (lowercase letters) and within the competition phase (uppercase letters). n.s., not significant; ***p < 0.001. Data are represented as mean ± s.e.
