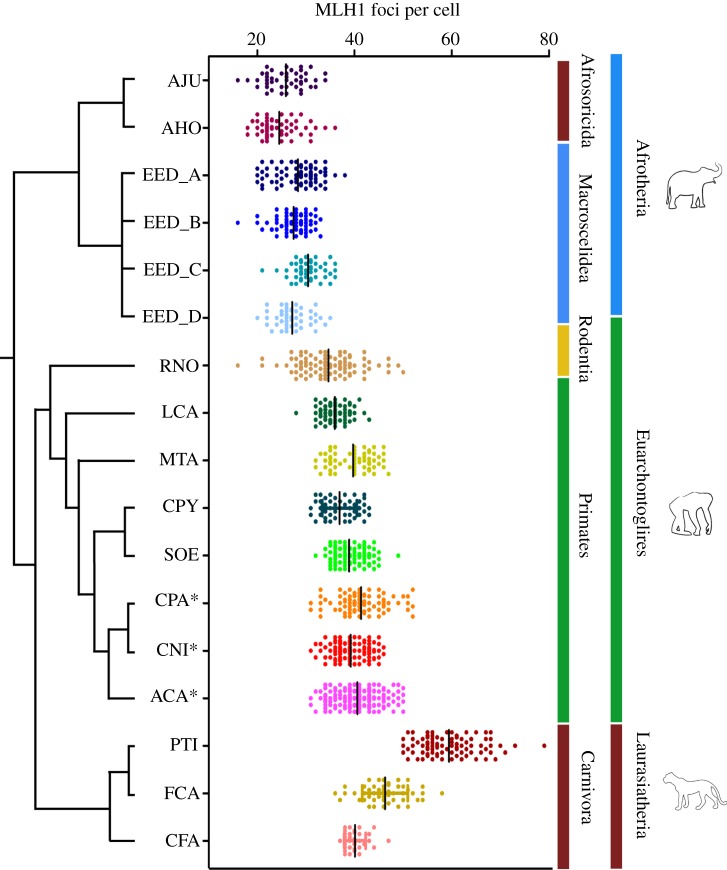
Figure 1.
The number of MLH1 foci observed per cell in specimens analysed and their phylogenetic relationships. A. julianae (AJU), A. hottentotus (AHO), E. edwardii (four individuals, EED_A to EED_D), R. norvegicus (RNO), L. catta (LCA), S. oedipus (SOE), C. pygmaea (CPY), M. talapoin (MTA), C. paraguayanus (CPA), C. nigritus (CNI), A. caraya (ACA), C. familiaris (CFA), F. catus (FCA) and P. tigris (PTI). Asterisk denotes data obtained from [16]. The phylogenetic branches are not proportional to DTs (phylogenetic tree redrawn from [17]). Taxonomy follows [18]. See electronic supplementary material, table S2 for information on standard deviation, standard error, 95% CI for the coefficient of mean and coefficient of variation values.

