Figure 1.

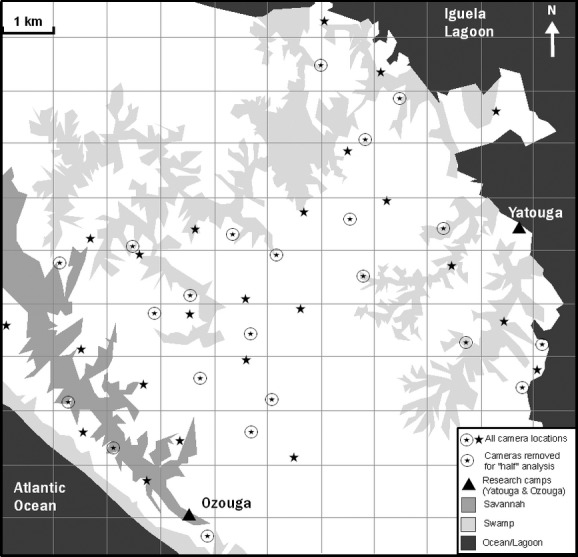
Study area and camera trap distribution showing the full array of cameras, and cameras removed from the analysis when running “half models” which included every second camera in the grid cells.

Study area and camera trap distribution showing the full array of cameras, and cameras removed from the analysis when running “half models” which included every second camera in the grid cells.