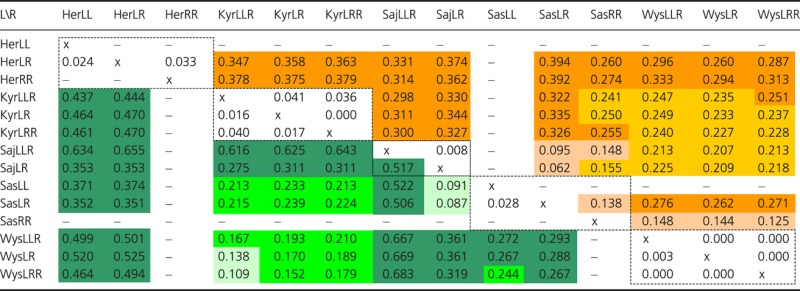
Table 3.
Pairwise FST values using Weir and Cockerham (1984) calculation
 |
Values for the R genomes are above the diagonal and values for the L genomes under it. 0 ≤ FST < 0.05 indicates little genetic differentiation (uncolored boxes), 0.05 ≤ FST < 0.15 moderate (light green for L and light orange for R), 0.15 ≤ FST < 0.25 great (green for L and orange for R), and 0.25 ≤ FST very great genetic differentiation (dark green for L and dark orange for R) (Wright 1978). x, no values calculated inside the same group of frogs. -, no value calculated because of the absence of one specific genome in the parental species.
