
Figure 2.
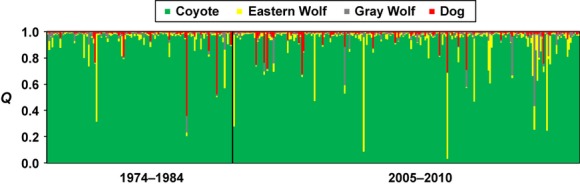
Structure assignments of historical (1974–1984) and contemporary (2005–2010) coyotes from southeastern Ontario genotyped at 12 autosomal microsatellite loci. Each partitioned vertical bar represents an individual's proportional membership to the K = 4 populations analyzed in Structure; Q-values represent the average of the F-model and I-model results.