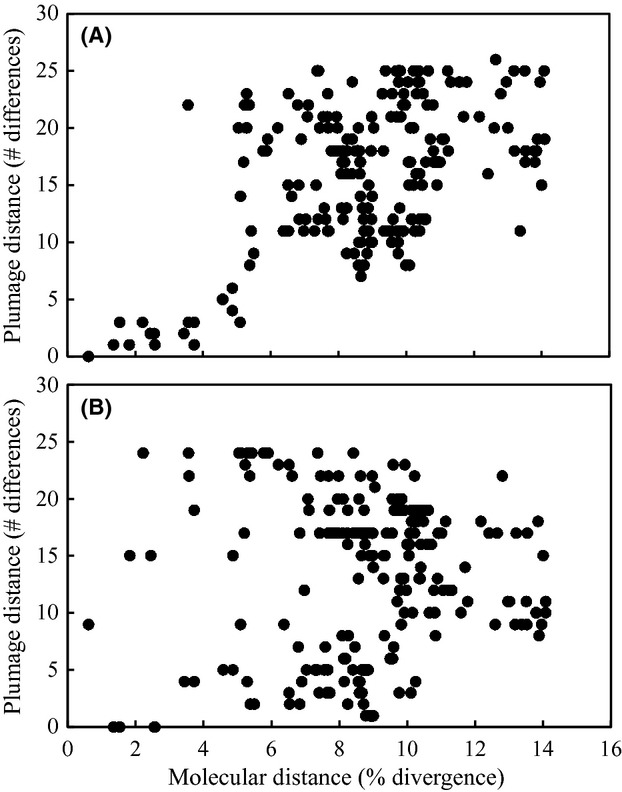
Figure 3.

Plots showing pair-wise plumage distances between taxa as a function of molecular sequence divergence in (A) males and (B) females. Male plumage differences have accumulated steadily and almost linearly as a function of molecular distance between taxa (R2 = 0.262), whereas female plumage distances show no clear relationship with molecular distance (R2 = 0.005). Molecular divergence values are uncorrected p distances based on four mitochondrial and three nuclear regions.
