Figure 1.

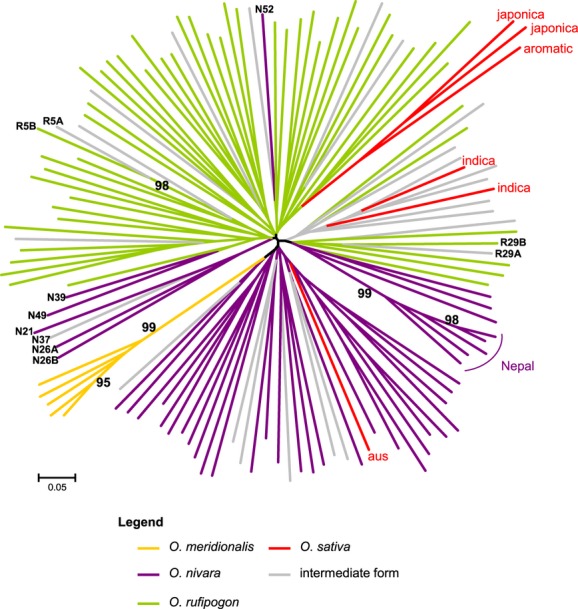
NJ tree of Oryza series Sativae populations based on C.S. Chord distance. Bootstrap values above 50% are displayed at the root of the supported cluster. The populations are colored according to their morphological classification.

NJ tree of Oryza series Sativae populations based on C.S. Chord distance. Bootstrap values above 50% are displayed at the root of the supported cluster. The populations are colored according to their morphological classification.