Figure 3.

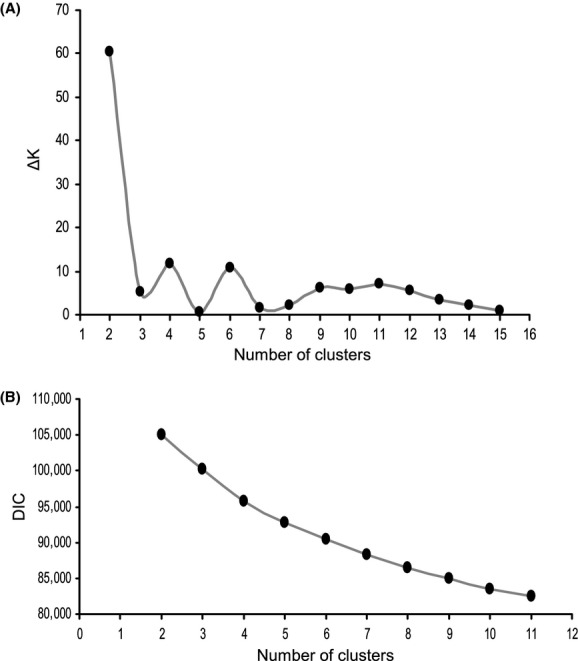
Criteria used in determining the appropriate cluster solution: (A) Delta K plot of STRUCTURE runs based on ln P(D) values; and (B) Plot of the mean DIC value of each TESS cluster solution. Plot lines were added to help visualize trends.

Criteria used in determining the appropriate cluster solution: (A) Delta K plot of STRUCTURE runs based on ln P(D) values; and (B) Plot of the mean DIC value of each TESS cluster solution. Plot lines were added to help visualize trends.