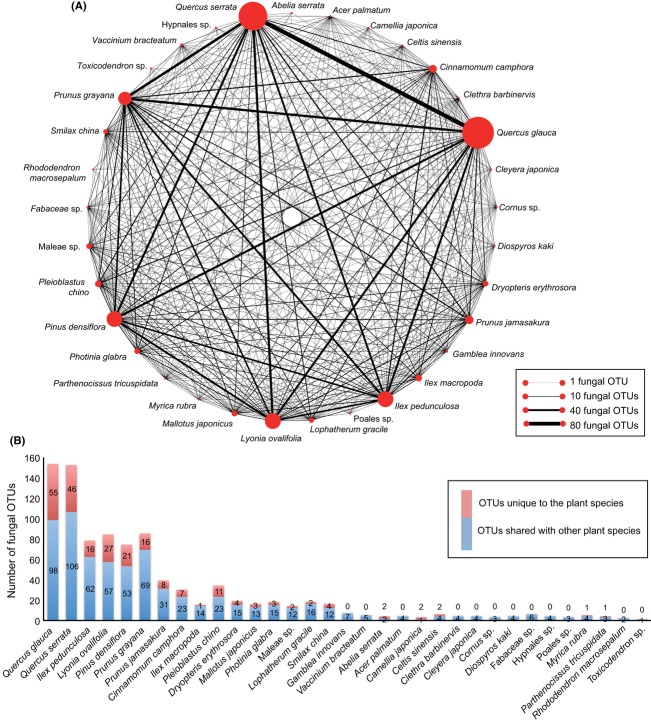
Figure 1.
Sharing of fungal OTUs among plant species in the community. (A) The number of fungal OTUs shared among plant species. The line thickness is proportional to the number of fungal OTUs shared between each pair of plant species. The size of circles roughly represents the composition of plant species in the samples (Fig. S1A). Common plant species in the community are located away from each other so as to make it easier to grasp the number of shared fungal OTUs. (B) The number of fungal OTUs detected from each plant species. The number of OTUs identified only from a focal plant species (OTUs unique to the plant species) and that of OTUs that was detected also from plant species other than the focal one (OTUs shared with other plant species) is separately shown. Plant species are shown in the decreasing order of the number of terminal root samples (Fig. S1A).

