Figure 2.
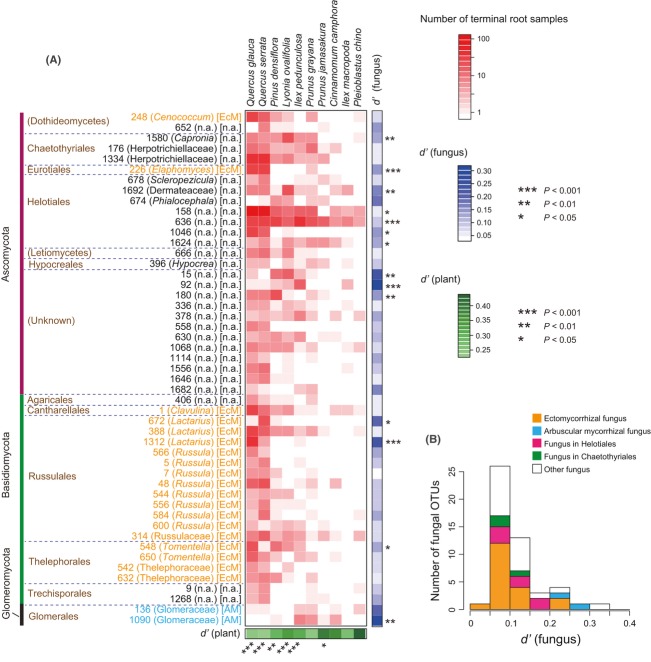
Association specificity analysis. (A) Plant × fungal matrix and the d′ measure of association specificity. The red boxes represent the number of times (terminal root samples) in which respective plant × fungal combinations are observed. Based on the d′ index of the specialization of interspecific associations (Blüthgen et al. 2007), association specificity of each plant species (green) and that of each fungal OTU (blue) were estimated. Results of plant species with 10 or more root samples (Fig. S1A) and the fungal OTUs that appeared in 10 or more root samples are shown. See Table S1 for d′ measures of all the examined plants and fungi. For each OTU, genus or family name is shown in a parenthesis and mycorrhizal type in a bracket. (B) Histogram of the association specificity of fungi. Results of the fungal OTUs that appeared in 10 or more root samples are shown.

