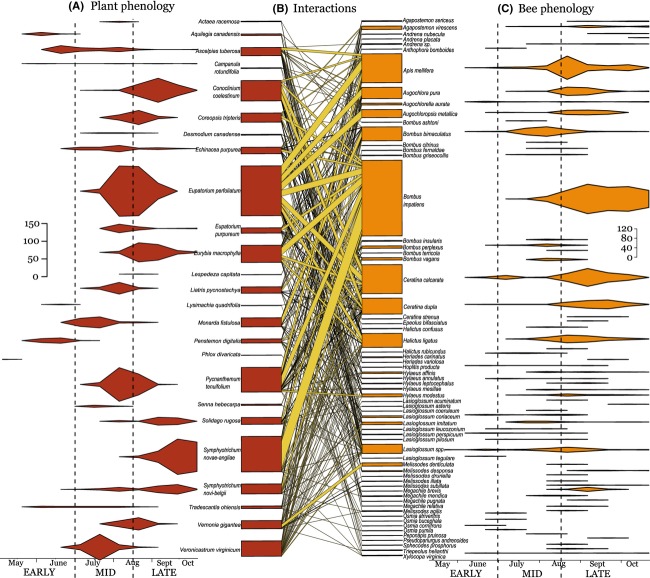
Figure 2.
The violin-shaped plots represent the interaction phenology of plants (A) and bees (C) over the summers of 2008 and 2009. The weeks correspond to biweekly sampling dates, beginning in early May and ending in mid-October. The length of the segments demonstrates the duration of the interactive interval of that species, whereas the height represents the abundance of interactions and demonstrates how they fluctuate over time (plotted on the x-axes). (B) This quantitative bipartite visitation network was constructed from collections of Apoidea species on flower species. The boxes (nodes) on the left represent plant species and the boxes on the right represent bee species. The height of each box is proportional to the number of interactions. Lines connecting plant and bee species represent floral visitation events and are weighted by abundance.

