
Figure 4.
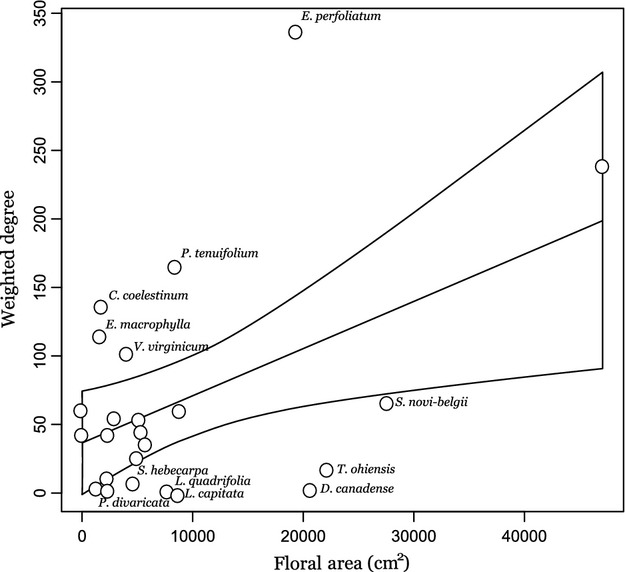
Plot of the relationship between weighted degree (visitation frequency) and floral area (summed across the summer), with 95% confidence intervals. Plant species that had more or fewer visits than would be expected given the relationship between floral area and weighted degree are labeled.