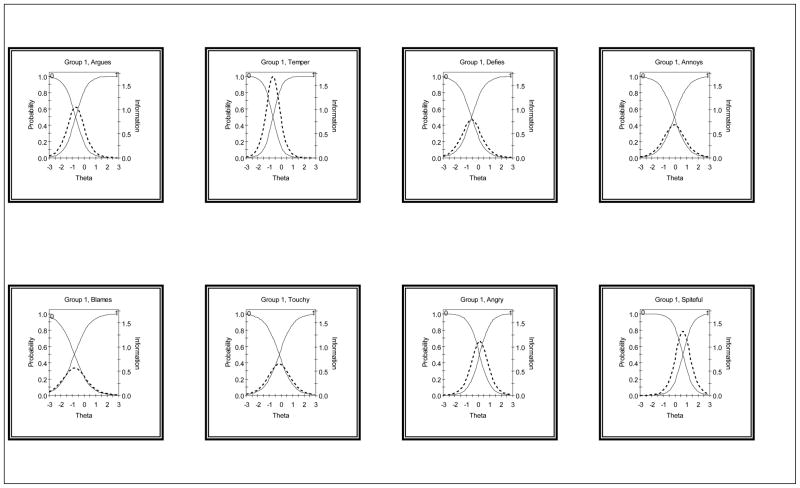
Figure 1.
Item characteristic curves (ICCs) and item information curves (IICs) for each of the eight ODD symptoms. ICCs are represented with solid lines. The probability of endorsing the item (labeled “1”) increases from 0.0 to 1.0 as theta increases. Conversely, the probability of not endorsing the item (labeled “0”) decreases from 1.0 to 0.0 as theta increases. IICs are represented with dotted lines. The peaks of the IICs indicate the level of theta at which each item provides maximum discrimination.

