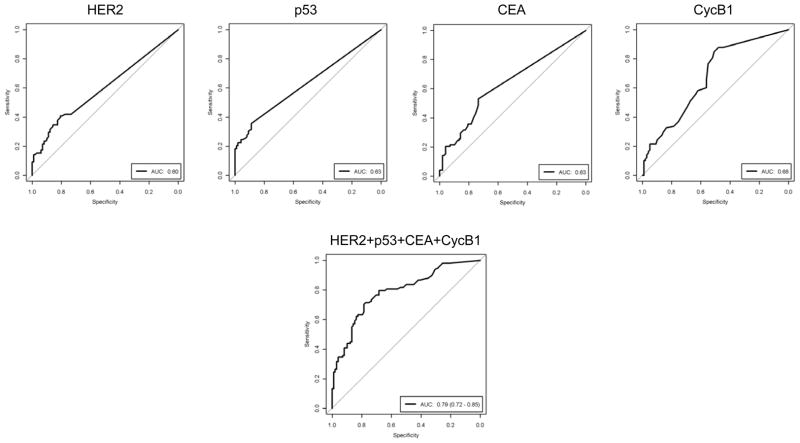
Figure 3. Sensitivity and specificity of the assay based on individual or combination of 4 serum antibodies for differentiating between breast cancer and control in the initial triage set.
ROC curves indicate the level of serum antibody (IgG) levels in sera from cancer patients (N=98), as compared with the Ab levels in sera from control donors (N=98). AUC denotes area under the curve.

