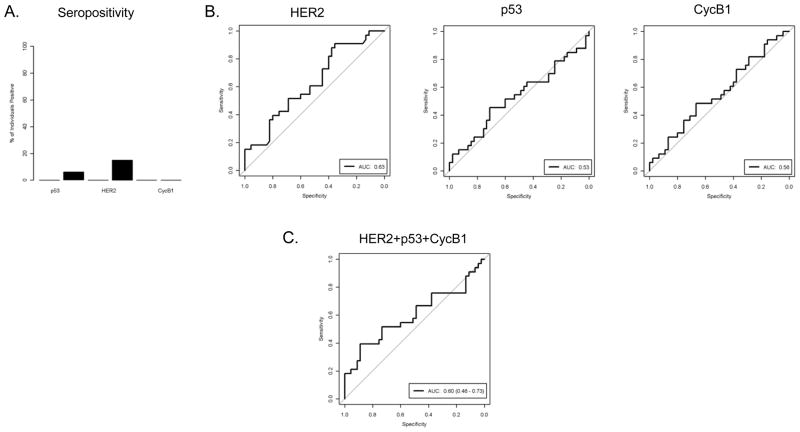
Figure 5. Sensitivity and specificity of the assay based on individual or combination of 3 serum antibodies for differentiating between breast cancer and control pre-diagnostic sera from WHI study.
(A) The seropositivity of antibodies to p53, HER2, and cycB1 in control and cases in WHI samples. The black bars indicate response rates in cases. The response rate in control was zero for all three antibodies. (B) ROC curves indicate the level of serum antibody (IgG) level to individual antigens, HER2, p53, and cycB1, in sera from cancer patients (N=33), as compared with the Ab levels in sera from control donors (N=45). AUC denotes area under the curve. (C) ROC curve indicates the level of serum antibody (IgG) level to the combination of HER2, p53, and cycB1 in sera from cancer patients and control. AUC denotes area under the curve.

