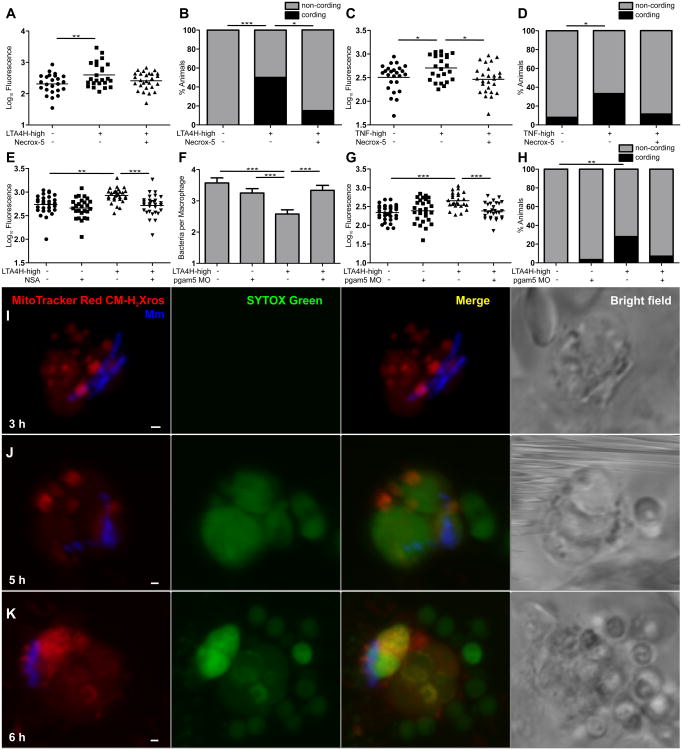
Figure 4. The TNF-RIP1-RIP3 axis mediates necrosis of infected macrophages through mitochondrial ROS production.
(A) FPC in WT and LTA4H-high larvae in presence or absence of 10 μM Necrox-5. **p < 0.01 (one-way ANOVA with Tukey's post-test). Representative of 2 independent experiments.
(B) Percentage of animals in (A) with cording among WT and LTA4H-high larvae in presence or absence of 10 μM Necrox-5. *p < 0.05; ***p < 0.001 (Fisher's exact test).
(C) FPC in WT and LTA4H-high larvae injected with TNF or vehicle in presence or absence of 10 μM Necrox-5. *p < 0.05 (one-way ANOVA with Tukey's post-test).
(D) Percentage of animals in (C) with cording among WT and LTA4H-high larvae injected with TNF or vehicle in presence or absence of 10 μM Necrox-5. *p < 0.05 (Fisher's exact test).
(E) FPC in WT and LTA4H-high larvae in presence or absence of 10 μM Necrosulfonamide (NSA). **p < 0.01; ***p < 0.001 (one-way ANOVA with Tukey's post-test). Representative of 3 independent experiments.
(F) Mean (±SEM) number of bacteria per infected macrophage in WT, LTA4H-high and PGAM5 morphant siblings on WT or LTA4H-high background. ***p < 0.001 (one way ANOVA with Tukey's post-test). Representative of 2 independent experiments.
(G) FPC in WT, LTA4H-high and PGAM5 morphant siblings on WT or LTA4H-high background. ***p < 0.001 (one-way ANOVA with Tukey's post-test). Representative of 2 independent experiments.
(H) Percentage of animals in (G) with cording among PGAM5 morphants on WT or LTA4H-high background. **p < 0.01 (Fisher's exact test).
(I-K) Confocal and bright field images of different infected macrophages in 1dpi larvae 3 (I), 5 (J) or 6 (K) hours post-TNF injection. Scale bars 1 μ m.
(Also see Figure S6).

