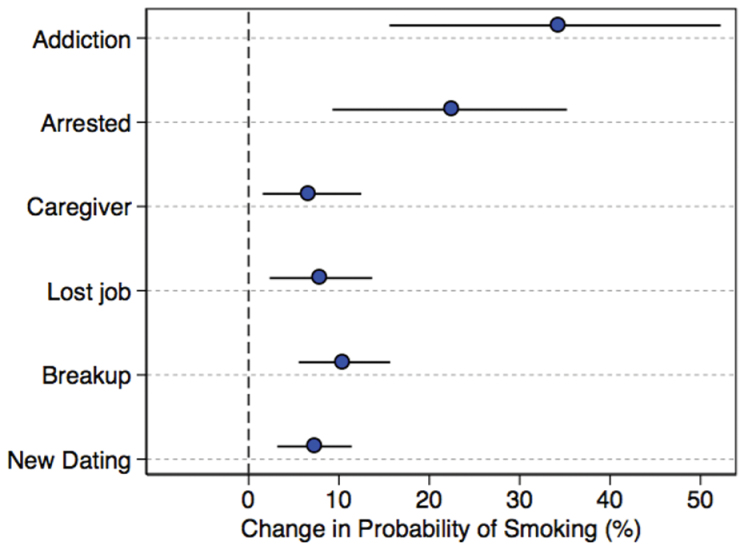
Figure 1.
Transitions and smoking show the change in predicted probability of smoking in the past 30 days with 95% CIs. An overlapping CI with zero would have indicated a null result with alpha = .002. Estimates were calculated by simulating the first difference in the transition, for example, lost job changing from 0 to 1. Each estimate was arrived by the use of 1,000 randomly drawn sets of estimates from each respective coefficient covariance matrix with control variables held at their mean values.

