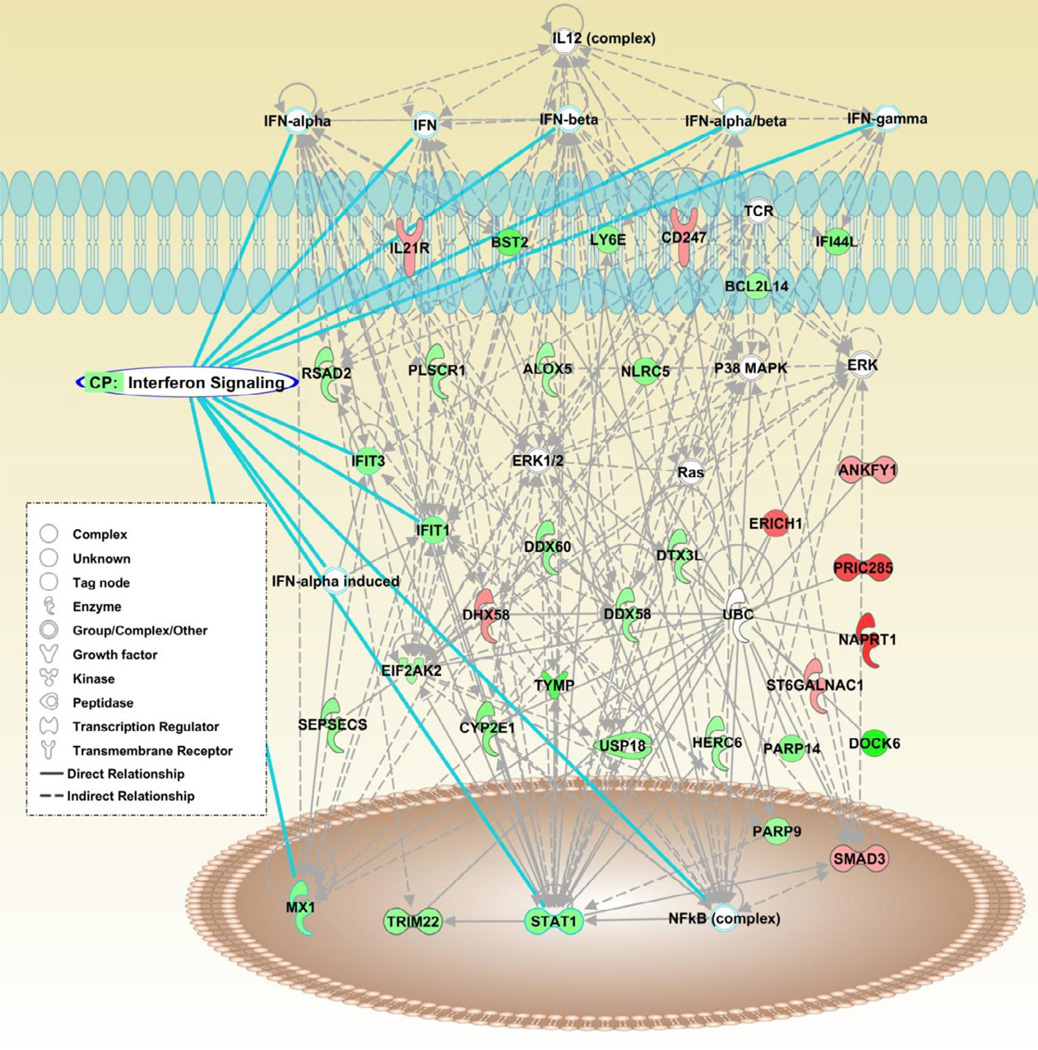
Figure 1.
Network analysis identifies the interferon pathway among differentially methylated genes in naïve CD4+ T cells from lupus patients. Genes hypomethylated in lupus patients in this network are in green, and hypermethylated genes are in red. Genes and molecules that are brought into the network by the analysis software due to statistically enriched relationships with differentially methylated genes are in colorless shapes. Analysis was performed using ingenuity software.

