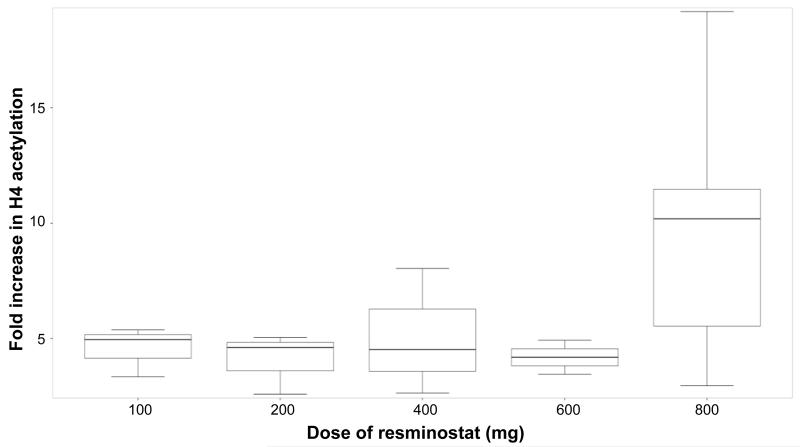
Figure 1b.
Box plots of median fold increase in histone H4 acetylation in PBMC after single dose of resminostat on C1D1; maximum fold increase of histone acetylation was chosen for each patient. Dose levels 100 mg to 600 mg: N=3 each, 800 mg dose level: N=6. The lower and upper boundaries of each box define the 25th and 75th percentiles; the horizontal line in each box indicates the median; and the bars define the lowest and highest values, excluding outliers.

