
FIGURE 3. Physiology of spatial attention in healthy adults.
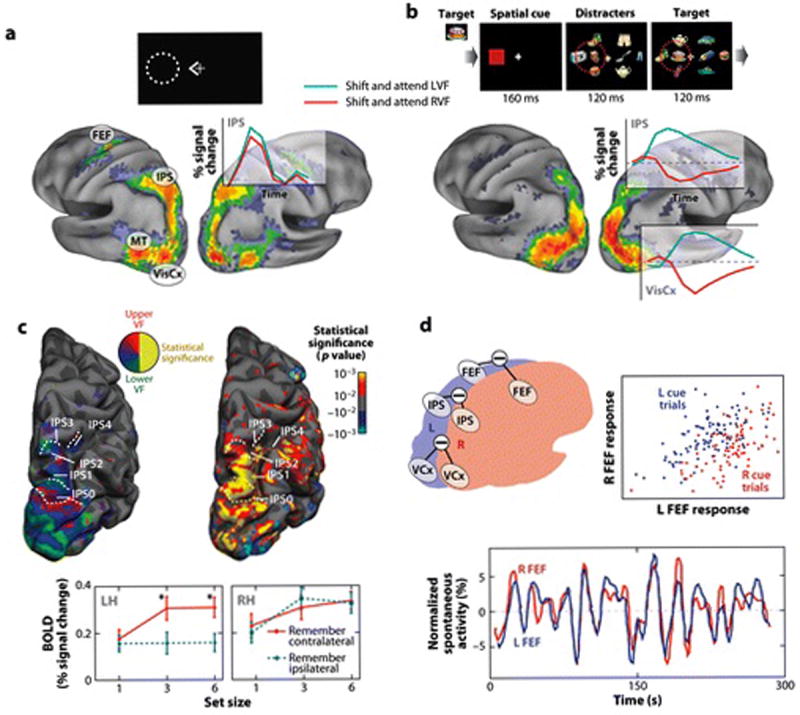
A) Dorsal fronto-parietal regions are activated following a central cue to shift attention. The statistical map shows the z-map from a meta-analysis of four experiments (n=58) in which BOLD activity was measured following a central cue to shift attention to a peripheral location (Astafiev et al 2003, Corbetta et al 2000, Kincade et al 2005). The time course of the response to the cue shows bilateral activity from right IPS with a contralateral preponderance indicating spatial selectivity. B) Occipital and dorsal fronto-parietal regions show spatially selective attentional modulations following a stimulus-driven shift of attention (from a meta-analysis of two experiments (n=47), (Shulman et al 2009) and (A. Tosoni, G.L. Shulman, D.L.W. Pope, McAvoy, M.P., and M. Corbetta, unpublished data). Subjects were cued to attend left or right to detect targets in a rapid-serial-visual-presentation (RSVP) stream presented among distracter streams. The z-map indicates voxels showing contralateral activity > ipsilateral BOLD activity following a shift of attention to the peripheral cue (red square). Note the strong spatially selective response in right IPS and visual cortex for shifting and attending to contralateral rather than ipsilateral stimulus streams. Also, maps for purely endogenous (Panel A) vs. stimulus-driven (Panel B) shifts of attention are very similar. C) Contralateral topographic maps in dorsal parietal cortex. The left image shows five contralateral polar angle maps along R IPS. The right image shows the activations in these maps during a VSTM task in which subjects remembered the orientation and location of target lines presented among distracters. The bottom graph shows a comparison of the magnitude of contralateral and ipsilateral activations in left and right IPS maps as a function of VSTM load. While left and right IPS contains contralateral polar angle maps (left IPS not shown), right IPS was equally activated by VSTM load in the contralateral and ipsilateral hemifieds but left IPS was only modulated by load in the contralateral hemifield (Sheremata et al 2010). This pattern of activity matches that postulated by the ‘standard’ model for neglect (Mesulam 1981). D) Inter-hemispheric coding of spatial attention. BOLD activity was measured following an auditory cue to attend to a peripheral location. The top right graph shows the magnitude of activity in L and R FEF on a trial-to-trial basis following leftward (blue dots) and rightward (red dots) cues. Activity in L and R FEF is highly correlated across trials, but a contralateral signal is superimposed on the positively correlated ‘noise’ (i.e. blue dots plot above red dots). This correlated ‘noise’ is partly explained by the presence of strong correlations at rest (bottom graph) between homologous regions (e.g. left-right FEF) or parts of maps (e.g. left-right fovea in V1). The locus of attention is only weakly predicted (AUC value=~.60, chance=.50) by ‘reading out’ activity only from the portion of the map in visual cortex or area (e.g. FEF) coding for the attended location. The prediction increases significantly (AUC=~.80) when subtracting activity from the attended-minus-unattended homologous portion of map or area in the two hemispheres (Sylvester et al 2007).