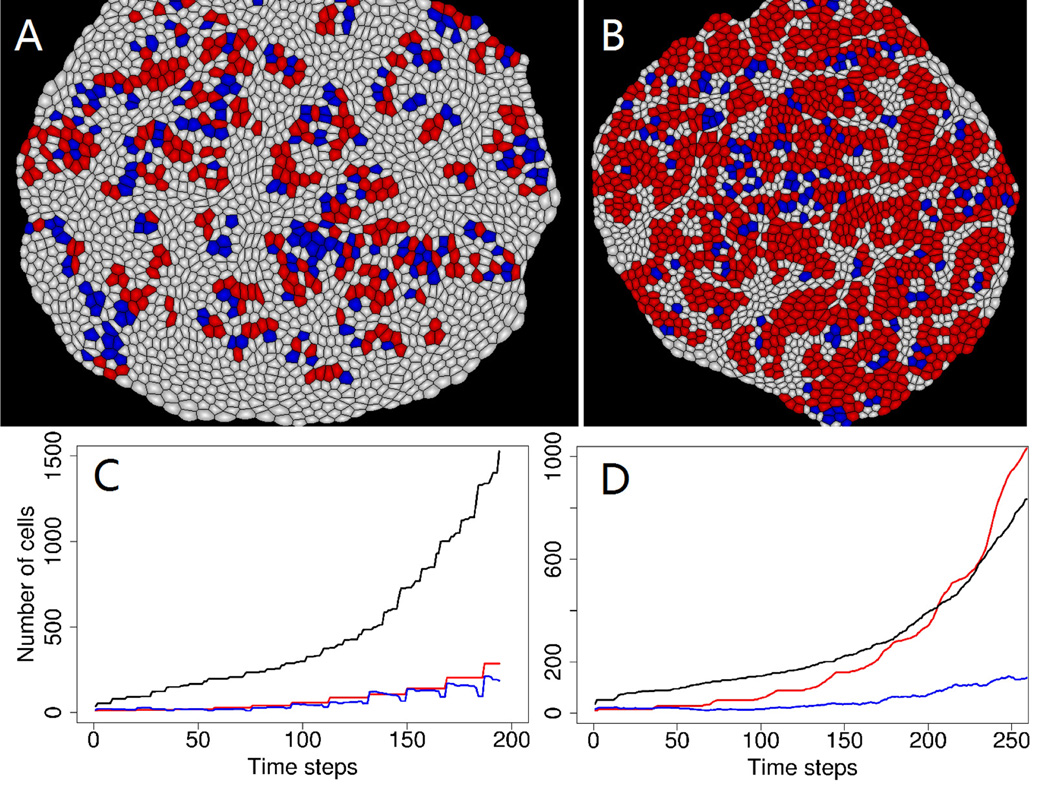
Fig. 4.
(A) A snapshot of simulations in tissue without any negative feedback controls. (B) A snapshot of simulations in tissue without inhibition to stem cell self-renewal. (C) Dynamics of cell numbers in tissue without any inhibitions. The red curve indicates the change of stem cell numbers, the blue line is for progenitor cells, and the black line is differentiated cells. (D) Dynamics of cell numbers in tissue without any inhibitions. The red curve indicates the change of stem cell numbers, the blue line is for progenitor cells, and the black line is differentiated cells.

