
Figure 8. Seagrass leaf widths.
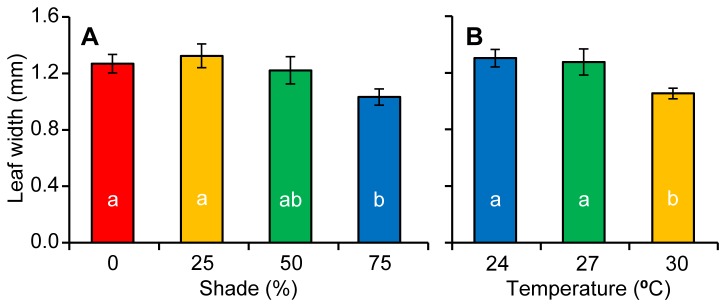
Leaf widths (Mean ± 1 S.E.) at the end of the experiment among showing a) different shade treatments and b) the three surviving temperatures treatments.
Official websites use .gov
A
.gov website belongs to an official
government organization in the United States.
Secure .gov websites use HTTPS
A lock (
) or https:// means you've safely
connected to the .gov website. Share sensitive
information only on official, secure websites.
Leaf widths (Mean ± 1 S.E.) at the end of the experiment among showing a) different shade treatments and b) the three surviving temperatures treatments.